From war and inflation to food and cargo, charts chronicle volatile year

By Andrew Stanley and Jeff Kearns
A strong chart that distills a compelling visualization of our world goes a long way toward helping illustrate what’s happening in the world’s economies and markets.
That’s why our Chart of the Week blog series features a new way to look beyond the numbers. Today’s edition compiles top 10 by readership so far in 2022.
From cargo prices and food costs to unrest, uncertainty, war, and inflation, these most-read blog posts reflect the eventful and often tumultuous year it’s already been.
Inflation to be Elevated for Longer on War, Demand, Job Markets
April 27, 2022

Dollar Dominance and the Rise of Nontraditional Reserve Currencies
June 1, 2022

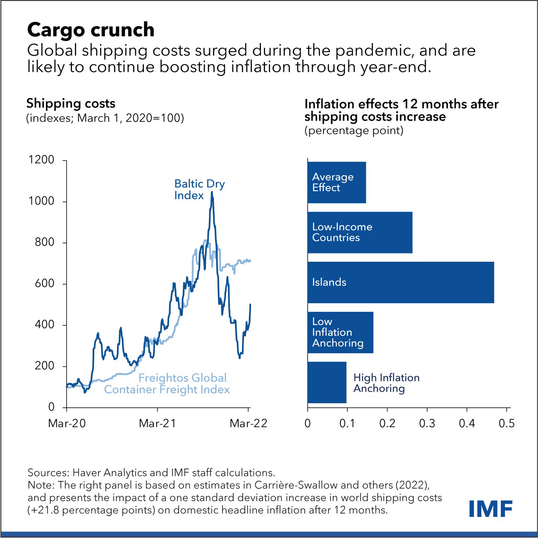
How Soaring Shipping Costs Raise Prices Around the World
March 28, 2022
See more: TCL Kicks Off its latest sponsorship with Football Stars to inspire greatness
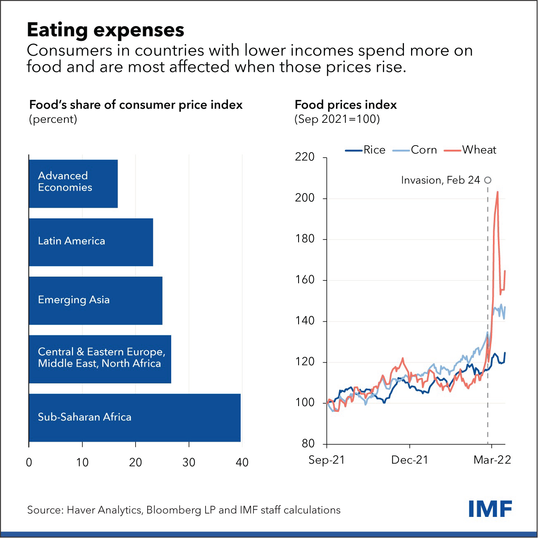
War-Fueled Surge in Food Prices to Hit Poorer Nations Hardest
March 16, 2022
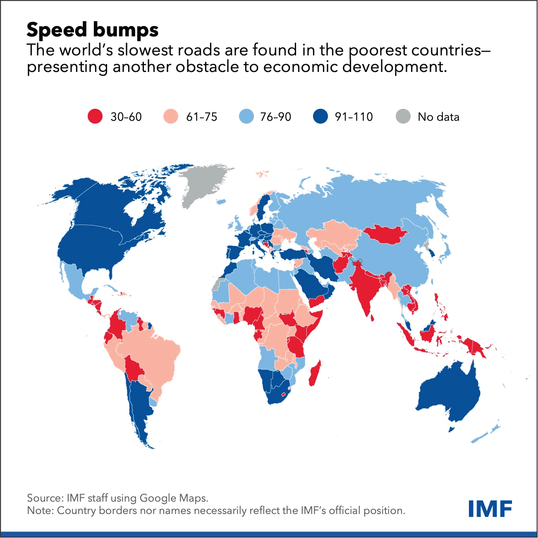
Where Are the World’s Fastest Roads?
June 15, 2022
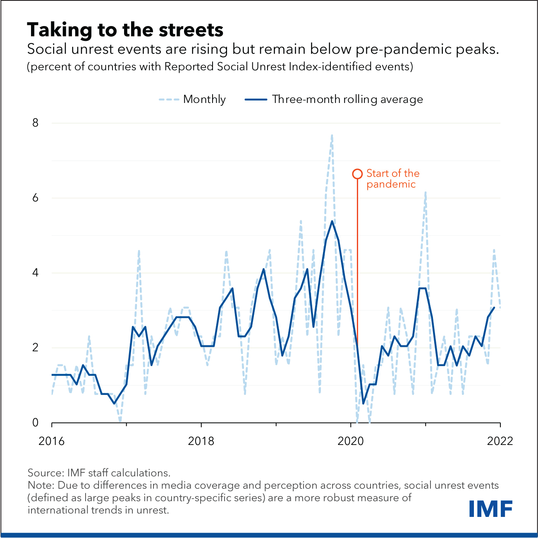
Social Unrest is Rising, Adding to Risks for Global Economy
May 20, 2022
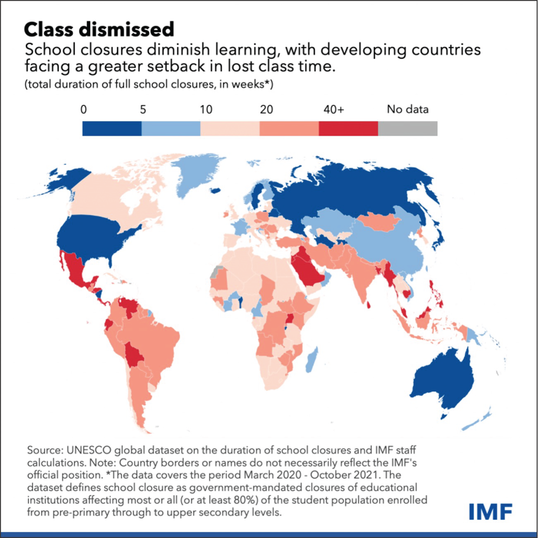
Pandemic Scars May be Twice as Deep for Students in Developing Countries
February 3, 2022
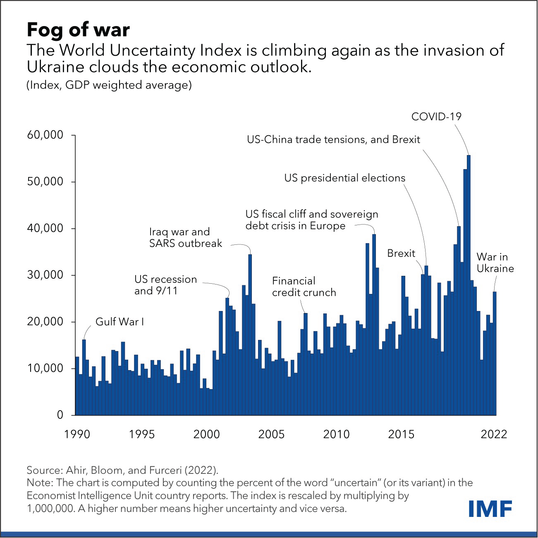
Global Economic Uncertainty, Surging Amid War, May Slow Growth
March 15, 2022
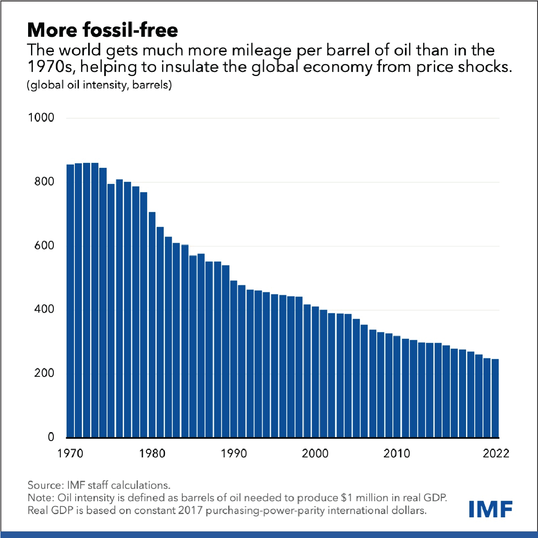
Lower Oil Reliance Insulates World From 1970s-Style Crude Shock
May 5, 2022
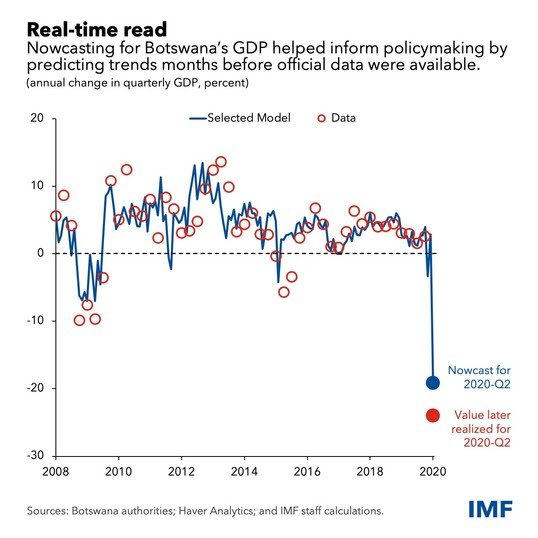
Real-Time Economic Indicators Help Better Track Activity in Africa
May 27, 2022